Section 1
Introduction
Section 2
The Maestro Interface
Section 3
Defining a Job
Section 4
Defining Recipients
Section 5
Defining Content
Section 6
Defining Tracking
Section 7
Sender and Delivery Options
Section 8
Outbox
Section 9
Delivered Jobs
Section 10
Reporting and Statistics
-
Tip Using Delivered Jobs Reports
- Figure 57 Define Report
10.1.1 Adding a Data Source Continued
10.1.2 Result Settings Continued
10.2 Executing Reports Continued
Section 11
User Settings
Appendix A
24 Hour Clock
Appendix B
International Character Sets
Appendix C
Comma Separated Files
Appendix D
AOL Rich Text
Section 10
Tracking Statistics and Reports
Once an e-mail job has been sent and enough time has gone by to reasonably assume that most recipients have received the message and have opened it, data from selected open-up and click-through events can be gathered. This data can be used to generate reports in two ways. The first way is by clicking on the Delivered Jobs icon (covered in Section 9.2). The second way is by clicking the Tracking Reports icon. Both of these methods are available from the home page or on the left side of most screens.
- Delivered Jobs Lists all of the e-mail jobs that have been delivered in a tabbed table format. The first tabbed page contains a summary table listing details about each job. The second tabbed page contains access to predefined reports ("quick reports") for that job, available only if tracking is switched on for the job in question. Click on the type of report desired and a temporary report is automatically generated based on the selected settings. This temporary report is not automatically saved. To save the quick report, click on the Create report icon at the bottom of the report. This opens the Define Report screen. Click on OK to save the report and return to the reports list, or click on Save & Execute to execute (display again) and save the quick report as a regular report.
- Tracking Reports Opens the list of reports. Clicking the New Report button opens a series of pages that guides the user through the process of custom building a new report by defining data to collect and how to view or download that data. Clicking on the Edit link of an existing report opens a series of pages that guides the user through the process of editing the report.
LISTSERV Maestro can generate several different types of reports with either of these methods, or data can be downloaded for use in other statistical analysis programs. For quick reports on delivery tests, click on the Test Reports tab on the Job Details screen (for more information on test reports see Section 7.3 Running Test Reports).
![]() In many cases, it is easier to start from one of the quick reports available
from the Delivered Jobs
interface, save it, and then make changes using the edit link in reports
than to start from scratch.
In many cases, it is easier to start from one of the quick reports available
from the Delivered Jobs
interface, save it, and then make changes using the edit link in reports
than to start from scratch.
Editing tracking reports is a more detailed way to generate custom reports. Unlike the "quick reports" available from Delivered Jobs, (or Test Reports for delivery test data) it is possible to combine data from multiple jobs as well as custom design the color of each data source. To create a new report or edit an existing report, click on the Tracking Reports icon. A listing of previously created reports appears, unless no reports have been generated. Click on a report title to execute and view that report. Click on the Edit link to open an existing report, or click the New Report button to create a new report.
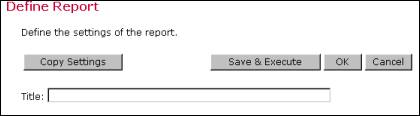
Clicking the New Report button or the Edit link will open the "Define Report" screen. There are four top buttons and a text box to type in a report title:
- Copy Settings Copies settings from a previously generated report to the new report.
- Save & Execute Saves the report and executes the collection of the selected data as well as a graph based on the settings.
- OK Saves any selections or entered information such as a title.
- Cancel Cancels any settings or entered information.
Figure 56 Define Report Top Part of Screen
Below the buttons is a tabbed table. Click on the tabs to toggle between the sections.
- General Settings Defines the time period of the report, including time zone, and team collaboration settings.
- Data Sources Opens the data source wizard, a series of screens that leads the user through the process of creating new data sources.
- Result Settings Defines the type of report and how the data from the job is displayed.
Figure 57 Define Report Screen
- Report Period Determines the earliest and the latest points in time that are considered when the events are retrieved from Maestro Tracker.
- Automatic LISTSERV Maestro will determine the time period to fit the registered events. From all the events of all of the jobs and/or URLs that are part of the report, LISTSERV Maestro will set the time of the earliest event as the "From" and the time of the latest event as the "To" values of the time period. If two jobs are selected for tracking, LISTSERV Maestro will select the delivery time of the first recieved event (open-up or click-through), from either job as the start time, and the time of the last received event from either job as the end time.
- Defined Period User can determine the time period for the report, and make this relative to any time zone.
- Team Collaboration Click on the Edit link to change the team collaboration settings for the report.
Delete the Report will delete the report presently open, if the user has permission.