Section 1
Introduction
Section 2
The Maestro Interface
Section 3
Defining a Job
Section 4
Defining Recipients
Section 5
Defining Content
Section 6
Defining Tracking
Section 7
Sender and Delivery Options
Section 8
Outbox
Section 9
Delivered Jobs
Section 10
Reporting and Statistics
10.1.1 Adding a Data Source Continued
10.2 Importing Statistics
Section 11
User Settings
Appendix A
24 Hour Clock
Appendix B
International Character Sets
Appendix C
Comma Separated Files
Appendix D
AOL Rich Text
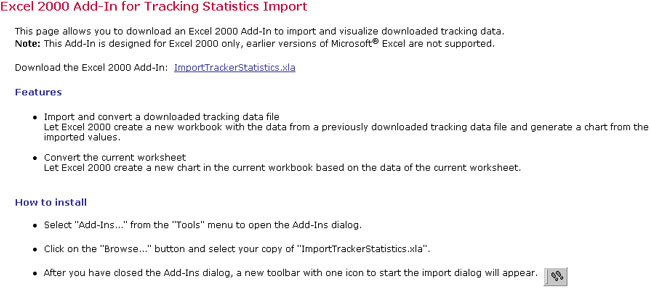
10.3 Importing Statistics in Microsoft® Excel
The statistics downloaded from LISTSERV Maestro are in CSV format. They can easily be imported into Microsoft Excel in order to create tables, graphs, and other forms of reports. LISTSERV Maestro comes with an easy to use Excel Add-In that makes this import process a matter of a few clicks.
10.3.1 Downloading the LISTSERV Maestro Excel Add-In
The add-in must be installed into Excel before it can be used. This step is done only once on each local computer, before the add-in is used for the first time. Click the download link located on the "Download Report Results" screen to download the add-in file to a local drive. The name of the file to download is ImportTrackerStatistics.xla
Figure 72 Excel Add-In for Tracking Statistics
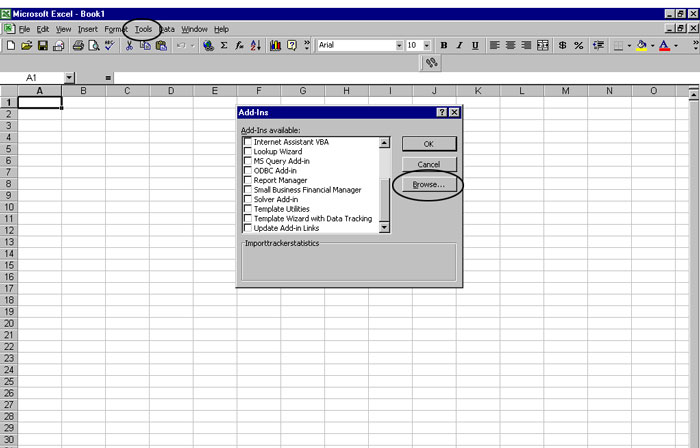
10.3.2 Installing the LISTSERV Maestro Add-In into Microsoft Excel 2000
Follow the steps described below to install the add-in into Microsoft Excel 2000:
- Open up Excel and select the "Add-Ins " command from the "Tools" menu (it may be necessary to click on the small arrow symbol at the bottom of the menu to make the command visible). A dialog that shows all available add-ins is opened. Click on the Browse button in that dialog box.
Figure 73 Installing Tracker Add-In
- By clicking the Browse
button, a file selection dialog box
opens. Navigate to the folder where the downloaded file was saved and
then click OK.
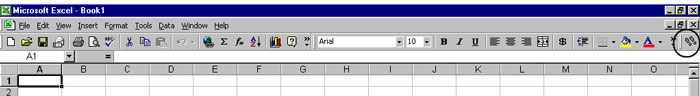
After clicking OK, the add-ins dialog box reappears. There will now be an entry for the LISTSERV® Maestro add-in, which should already have a check mark in front of it (if not, check the box). Click OK to install the add-in. - A new toolbar button that looks like two footprints will appear in the Excel toolbar. This button will start the LISTSERV® Maestro data import.
Figure 74 New Excel Tool Bar Button
10.3.3 Using the LISTSERV Maestro Microsoft Excel Add-In
Download the data to be imported into Excel. The data is downloaded in a compressed ZIP file. Open the ZIP file. There are two files contained inside, a readme.txt file and another file named for the type of data downloaded. Extract the *.txt files and save them to a location on the local drive.
The readme.txt file will contain a summary of the report type and other information. The other file, named for the type of data downloaded, such as distributionReport.txt or uniqueSumReport.txt contains the data that will be imported into Excel. Start Excel and click on the Visualize Tracking Statistics button in the toolbar, it looks like two small footprints, see figure 67.
The Visualizing Tracker Statistics import dialog box will open. Select the "Import and convert a downloaded tracking data file" option button to create a new workbook and generate a chart based on the downloaded tracking data. Select the "Convert the current worksheet" option button, to create a new chart in the current workbook based on the data of the current worksheet. Click Start to proceed.
Figure 75 Using Tracker Add-In with Excel Import Dialog Box
After clicking the Start button, a file selection box will open. Navigate to the *.txt file with the tracking data previously downloaded and open this file. Excel will automatically open a new workbook. Once the workbook has been created successfully, save it using the Save Statistic File dialog box. After the file had been saved, a message will appear saying the data has been successfully imported and saved as an Excel Workbook. Click OK to close the message.
The new workbook has two sheets. The first sheet shows the imported tracking data in chart form. The second sheet contains a value table with the downloaded tracking data.
Figure 76 Example Excel Graph Event Distribution Over Time
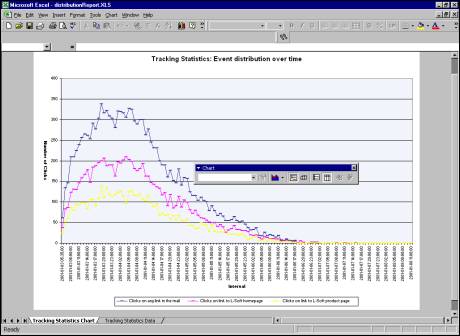
Figure 77 Example Excel Data Table

It is now possible to use all the regular Microsoft Excel features to edit and adjust both the graph and the data table.