Section 1
Introduction
Section 2
The Maestro Interface
Section 3
Defining a Job
Section 4
Defining Recipients
Section 5
Defining Content
Section 6
Defining Tracking
Section 7
Sender and Delivery Options
7.3 Test Reports
Section 8
Outbox
Section 9
Delivered Jobs
Section 10
Reporting and Statistics
Section 11
User Settings
Appendix A
24 Hour Clock
Appendix B
International Character Sets
Appendix C
Comma Separated Files
Appendix D
AOL Rich Text
Once a test message containing tracked data has been delivered and the test recipients have opened the message, the "Test Reports" tab, available from the Job Details screen, becomes active. Click on the tab to open up a definition page to generate a "quick report" on the test message data. "Quick Reports" are predefined report types that create a temporary report based on the selected report settings and the active e-mail job.
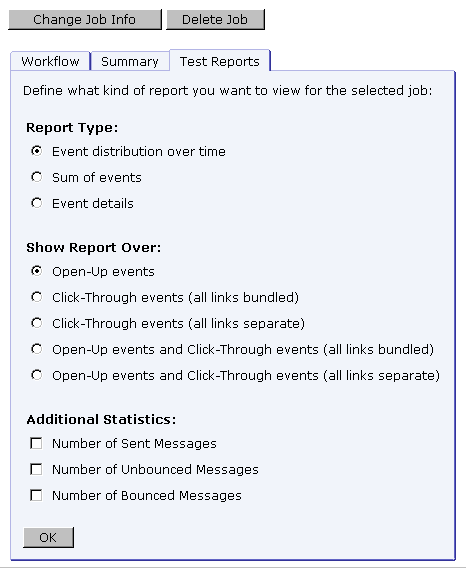
First, select the report type by clicking the corresponding option button. There are three different report types that are available depending on the type of tracking selected:
- Event distribution over time This report type produces a simple line graph showing number of responses over time. Time is plotted on the x-axis of the chart and events are charted on the y-axis. For more information see Section 10.2.1.
- Sum of events This report type produces
a bar graph that shows the number of recipients who clicked
on each URL and/or opened up the e-mail message. The
number of recipients is plotted on the y-axis and the
number of events is plotted on the x-axis.
Two types of sum can be chosen for the report, "Sum of unique events" or "Sum of all events." Sum of unique events records only a single event of each type for each recipient. This chart will register "0" (zero) events if blind tracking has been selected for the tracking type during the tracking definition because blind tracking cannot count any event as unique. Sum of all events counts all events triggered for each recipient. For more information see Section 10.2.2.
- Event details Displays a table that lists the report type, time period of the report, allows for the selection of encoding for downloading the data, and allows for the selection of the time zone to reference the downloaded data. Click the download link to download the raw data to a local drive. Raw data can be used in Excel or other statistical software to create detailed reports. Event detail reports are available for personal, anonymous, unique, and blind tracking jobs. For more information see Section 10.2.4.
Next, select the source data for the report type. Each data source will create a line or bar on the chart. There are up to five choices depending on the type of message (Plain Text or HTML), as well as the tracking events defined in the message:
- Open-Up events This option charts all the open-up events for a job. It is only available for HTML messages.
- Click-Through events (all links bundled) This option bundles all click-through events together into one variable charted on the report. For example, if three links were being tracked in a message, they would appear as one line or bar on the chart.
- Click-Through events (all links separate) This option creates separate variables for each click-through event that is tracked. For example, if three links were being tracked in a message, each link would appear as a separate line or bar on the chart.
- Open-Up and Click-Through events (all links bundled) This option puts all the open-up events into one variable and all the click-through events into a second variable charted on the report. It is only available for HTML messages.
- Open-Up and Click-Through events (all links separate) This option creates separate variables for each of the open-up and each of the click-through events. It is only available for HTML messages.
Other data sources can be added to the chart by selecting any or all of the "Additional Statistics" option buttons. These additional data sources can provide comparison data in the chart so that it is possible to see the total number of messages sent in relation to the number of open-up events that occurred, for example. Three Additional Statistics types are available:
- Number of Sent Messages This option adds the number of messages that were sent to LISTSERV as a constant reference value in the report.
- Number of Unbounced Messages This option adds the number of unbounced messages as a constant reference in the report. This value shows the number of messages that were sent and not detected as bounces by LISTSERV. This option is only available if LISTSERV handle bounces automatically (selected during the sender definition). For more information on bounces see the online help.
- Number of Bounced Messages This option adds the number of bounced messages as a constant value in the report. This value shows the number of messages that were sent but were detected as bounces by LISTSERV. This value can go up over time depending on the type of bounce LISTSERV detected. This option is only available if LISTSERV handles bounces automatically (selected during the sender definition). For more information on bounces see the online help.
Select a report type and a source data type, and any additional statistics using the option buttons. Click OK to continue. A temporary report with the settings selected will be generated and displayed on the screen. This report will not be saved (it can always be run again from the Test Reports tab).
Located at the bottom right side of the test report are four icons. Each icon opens a page with different functions and options. The currently selected icon will be highlighted with a blue border. Icons that are unavailable will appear grayed out. These icons appear on all test report and regular report pages. Their functions are as follows:
|
View Report - Displays the currently selected report with the latest report options. |
|
|
Download Report - Opens the "Download Report Result" screen. From here it is possible to download report data in a zipped text file. |
|
|
Change Results Settings - Opens the "Change View Settings for Report" screen. From here it is possible to change how the results are displayed on the report. |
|
|
Edit Report / Create Report - Opens the "Define Report" screen. From here it is possible to save a quick report as a normal report by clicking the Save & Execute button. For delivery tests, it is not possible to save a quick report as a regular report, so this icon is disabled (grayed out). |
For more information on quick reports see Section 9.2 Delivered Jobs Reports in this guide. For more information on creating and editing reports, see Section 10 Tracking Statistics and Reports.