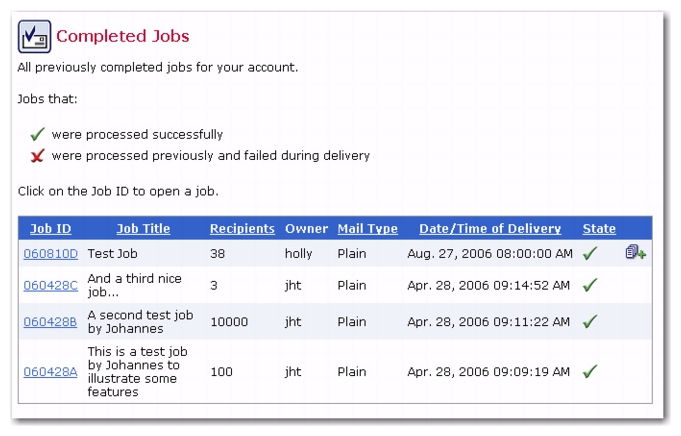
The Completed Jobs Screen contains a list of all email jobs that have attempted delivery and the present state they are in, either processed successfully or failed during delivery. To access this screen, perform one of the following actions:
|
•
|
Sort the job listing – The column headers in the table are links that, when clicked, will sort the jobs in ascending (one click) or descending (two clicks) order. Each subsequent click will reverse the sort order.
|
Note: It is not possible to sort the table using the Owner column.
|
•
|
View the details for any job – Click on the Job ID to open the Completed Job Details screen, which is where you can edit or view various parts of the job.
|
Important: A job might be processed successfully but still fail to be delivered. The processing state only describes the success or failure of the act of transferring the job to LISTSERV. If, for some reason, LISTSERV fails to actually deliver the job, then no message(s) will be sent and the job will be listed in the successful state.
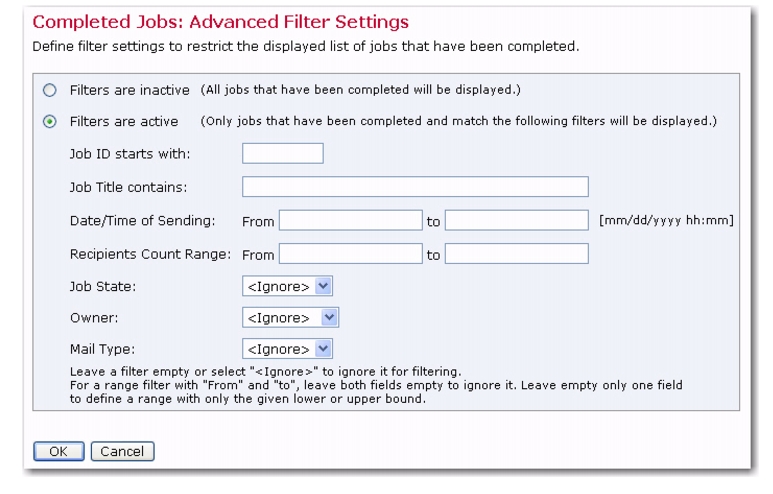
The Completed Jobs: Advanced Filter Settings screen lets you activate and define an advanced filter for the Completed Jobs list. To access this screen, click on the
Advanced Filter Settings link on the Completed Jobs screen.
If the filter is set to active, then only jobs that fulfill the filter condition will be displayed in the list. Define the active filter condition as follows:
|
•
|
Job ID starts with or Full Job ID starts with – Enter a text string that is used as a "starts with" filter for the job ID. Only jobs where the job-ID (or the full job-ID, including the ID-prefix) starts with the given text will be included. Whether or not the job-ID or the full job-ID will be used for filtering is determined by your preference setting for job-ID prefix. If the prefix is included in the job list, then this filter will be applied to the full job-ID, including the prefix (as it is displayed in the job list). If the job-ID prefix is not included, then this filter will only apply to the bare job-ID, without the prefix. Leave this field empty if you do not want to filter over the job ID.
|
|
•
|
Job Title contains – Enter a text string that is used as a "contains" filter for the job title. Only jobs where the job title contains the given text string (case sensitive) will be included. Leave empty if you do not want to filter over the job title.
|
|
•
|
Date/Time of Sending – Enter a From and/or a To date and time (in the displayed format) to define a time range filter. If only a From date/time is entered, only jobs where the date/time is the given date/time or later will be included. If only a To date/time is entered, only jobs where the date/time is the given date/time or earlier will be included. If both a From and To date/time is entered, only jobs where the sent date/time is between the two given borders (including the borders themselves) will be included. Leave empty if you do not want to filter over the date/time.
|
|
•
|
Recipients Count Range – Enter a From and/or a To range to define a number range filter. If only a From number is entered, then only jobs where the number of recipients is the given number or higher will be included. If only a To number is entered, then only jobs where the number of recipients is the given number or lower will be included. If both a From and To number is entered, then only jobs where the number of recipients is between the two given borders (including the borders themselves) will be included. Leave empty if you do not want to filter over the number of recipients.
|
|
•
|
Job State – Select one of the jobs states (OK or Failed ) to define a job state filter. Only jobs with the matching job state will be included. Select <Ignore> if you do not want to filter over the job state.
|
|
•
|
Owner – If applicable, select an owner from the drop-down menu. Only jobs with the matching owner will be included. Select <Ignore> if you do not want to filter over the owner.
|
|
•
|
Mail Type – Select one of the mail types ( HTML or Plain) to define a mail type filter. Only jobs with the matching mail type will be included. Select <Ignore> if you do not want to filter over the mail type.
|
Note: If you define any filter settings and later set the filter to "inactive", then the filter settings will still be remembered, which means you can easily activate them again at a later time.
Only the first job of an auto-repeat sequence is normally shown in the list of completed jobs. This is to avoid making the list overly long, filled with many jobs with the same job title, but with different Job IDs and delivery times. The first job of a sequence is marked by the
Sequence icon.
By clicking on the Sequence icon, the sequence expands and displays all jobs in that sequence. From there, select any of these jobs by clicking on its ID. To hide the sequence jobs, simply click on the
Sequence icon again or click on the icon of a different sequence, which will expand that other sequence and hide the sequence that was previously expanded. Only one sequence can be shown at a time.
Note: A job might be processed successfully but still fail to be delivered. The processing state only describes the success or failure of the act of transferring the job to LISTSERV. If LISTSERV fails to deliver the job, no messages will be sent, but the job will still be in the “successful” state inside of LISTSERV
Maestro. For example, if a job is sent to a LISTSERV list with the
Standard list submit option, and using a sender address that is
not authorized to post to the list, then the job will be successful, but LISTSERV sends an error message to the non-authorized email address, and no messages to recipients are actually delivered.
Tip: If a user suspects that a job that is shown as “successful” was actually never sent – for example, because recipients report that they never got the message – then the administrator should check the LISTSERV logs to find out what happened to the job.
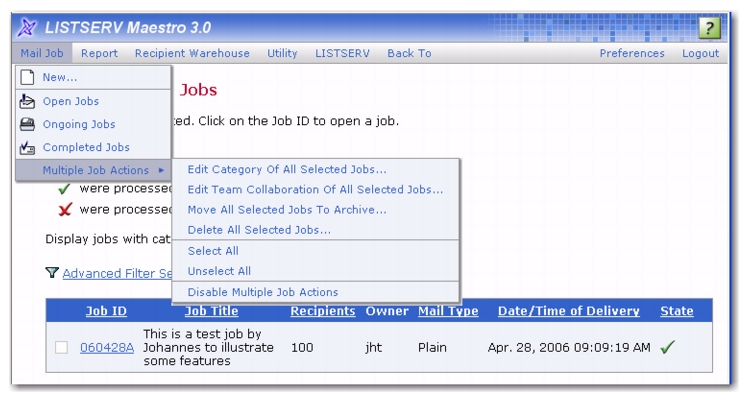
From the Completed Jobs screen, you can also perform certain actions on several jobs at once by using the Multiple Job Actions feature. This feature is normally disabled. To enable it, click
Mail Job >
Multiple Job Actions >
Enable Multiple Job Actions. The Completed Jobs screen will refresh and each job will have a checkbox next to it. In addition, the
Mail Job menu will show additional entries that can be performed on several jobs at once.
To manipulate several jobs at once, check all jobs that you want to edit and then select the desired option from
Multiple Job Actions submenu (located on the
Mail Job menu). These options include:
|
•
|
Edit Team Collaboration of All Selected Jobs – Opens the Edit Team Collaboration of All Selected Jobs screen. Grant ( yes), revoke ( no), or keep as is ( keep) the team collaboration permissions for the selected jobs. You can also load the permissions from a specific job and then apply these permissions to the selected jobs.
|
|
•
|
Move All Selected Jobs to Archive – Opens the Move Selected Jobs to Archive screen. Click [Move to Archive] to move the selected jobs to the archive. Archived jobs will no longer be viewed from within LISTSERV Maestro until they are imported by the administrator.
|
Note: Once the Multiple Job Actions feature is enabled, then it will be enabled on all other job list screens (i.e. the Open Jobs Screen and the Ongoing Jobs Screen) until you disable it again.
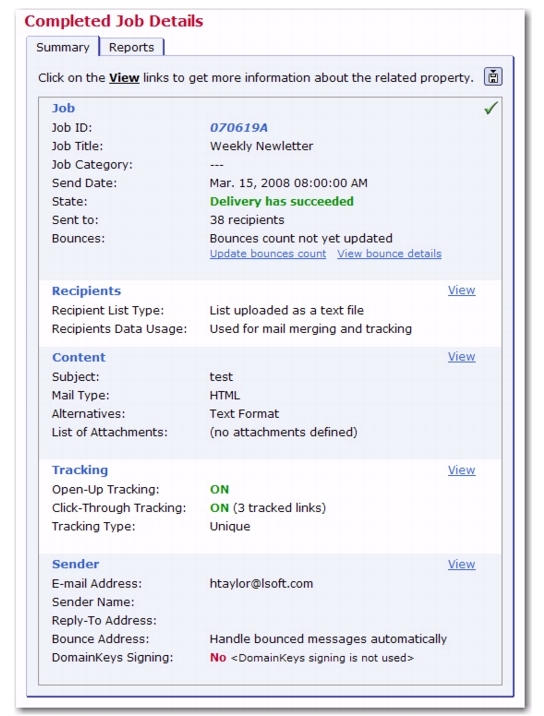
The Summary tab of the Completed Job Details screen displays information about the completed job. Click on
View adjacent to a section to see more information on that particular section. Two additional links are available here –
Update bounce count and
View bounce details (See Section 12.4.1
Viewing Bounce Details for more information).
In the Tracking section, you can now see how many links are being tracked.
From the Summary tab of the Completed Job Details screen, it is possible to update the bounce count and generate a graphical representation of the number and type of bounces for the job. Click on the
View bounce details link to open the Bounce
Details screen.
The Bounce Details report is comprised of color-coded bars that represent the number and type of bounces. The top bar displays the total number of al bounces. The bars below represent the total number of bounces divided into different bounce types. Bounce types are based on RFC error codes that define the characteristics of why the message bounced. The codes are documented in RFC 1893 "
Enhanced Mail System Status Codes".
|
•
|
Address related errors (RFC 1893 4.1.x and 5.1.x). Includes errors like "Unknown user at host" or "Unknown host".
|
|
•
|
Network related errors (RFC 1893 4.4.x and 5.4.x). Includes routing errors and errors like "No answer from host" or "Bad connection".
|
Use the check box adjacent to each bar to select it for download. Use the drop-down menu to download only those email addresses that bounced, or the email addresses with the delivery failure information included.
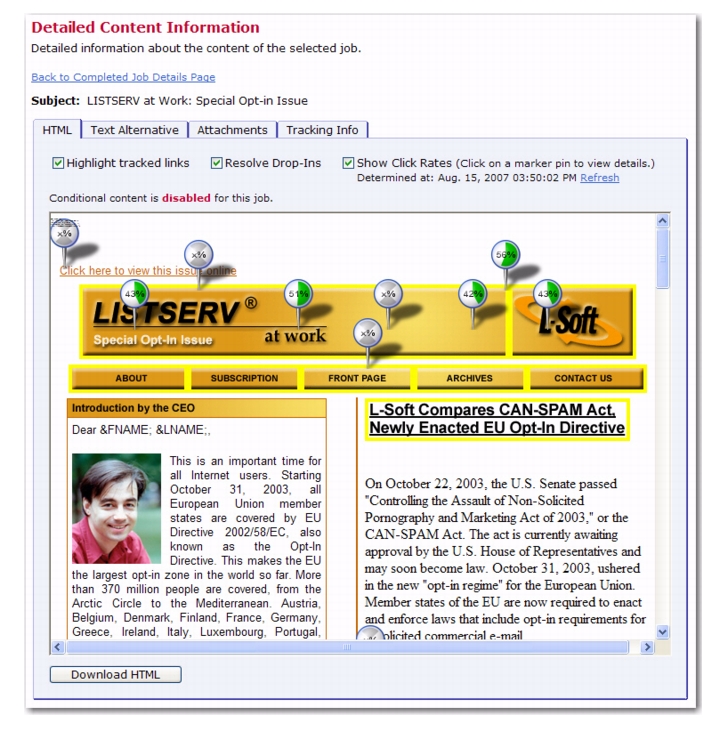
The Detailed Content Information screen lets you view the content and tracking information of an email job that has already been delivered, that is currently being sent, or that is authorized for sending and currently waiting for the scheduled send time.
To access this screen, click on the View link in the
Content section of the Completed Job Details screen.
View the subject line, message body, attachment list, and tracking information by switching between the available tabs. If the message is an HTML message with a plain text or AOL format alternative, then you may also view these alternatives.
Use the available download buttons and links to download the HTML body and/or attachments. HTML files will be downloaded in a ZIP format (compressed archive). Depending on the type of the attachment, it will either be saved to a disk or opened directly in your Internet browser.
If drop-in content is enabled for the message, then you can toggle resolution of drop-in elements with the
Resolve Drop-Ins option, allowing you to display the drop-in placeholders instead of their drop-in content. If errors have been encountered while LISTSERV Maestro tries to replace the drop-in placeholders with the drop-in content, then an error message is displayed and the un-replaced drop-in placeholders are highlighted in the message preview.
If the message contains links that are tracked for click-through tracking (either in the plain text body, the HTML body, or any of the alternatives), you can toggle highlighting of the tracked links with the
Highlight tracked links option.
Also for a message with link tracking, you can use the Show Click Rates option to view the click rate of each tracked link directly here in the content: If the option is enabled (checked), then a marker pin will be "pinned" into each tracked link, where the head of the pin displays the click rate, both as a numerical value and as a pie chart.
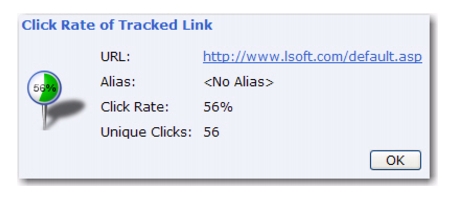
The click rates are displayed as a percentage value, showing how many percent of the recipients have clicked the corresponding link. You can click on a marker pin to see details about each link, which include the actual tracked URL, the tracking alias (if any), the click rate (in percent), and the absolute number of unique clicks on the link.
In addition, while the Show Click Rates option is enabled, the text just below the option will display the date and time when the click rate tracking data that is displayed was retrieved from the database. Click on the
Refresh link to refresh the data.
Note: LISTSERV Maestro does not discern between multiple occurrences of the same URL if they are also using the same tracking alias; therefore, if a tracked link appears at least twice with the exact same URL and alias, be it in the same content part or in different content parts, then the click rate that is displayed on each link's marker pin (and in the details popup when you click on a pin) does not display the actual unique clicks on the marked link, but instead the accumulated total rate of all links with the same URL and alias combination.
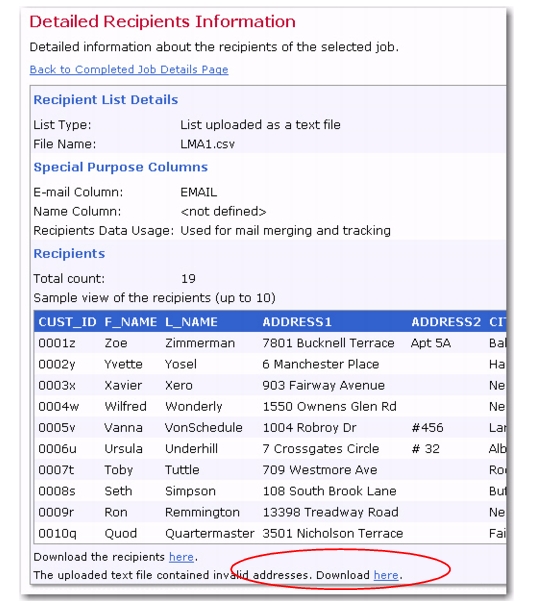
To download invalid recipients for a delivered job, click Mail Job, and select
Completed Jobs. The Completed Jobs screen opens. From here, click on the Job ID for the job you’d like to download recipients from. The Completed Job Details screen opens. Click on the
View link in the
Recipients section. The Detailed Recipients Information screen opens.
Note: This is only available for recipients that were uploaded from a text file or when LISTSERV Maestro selects the recipients from a database.
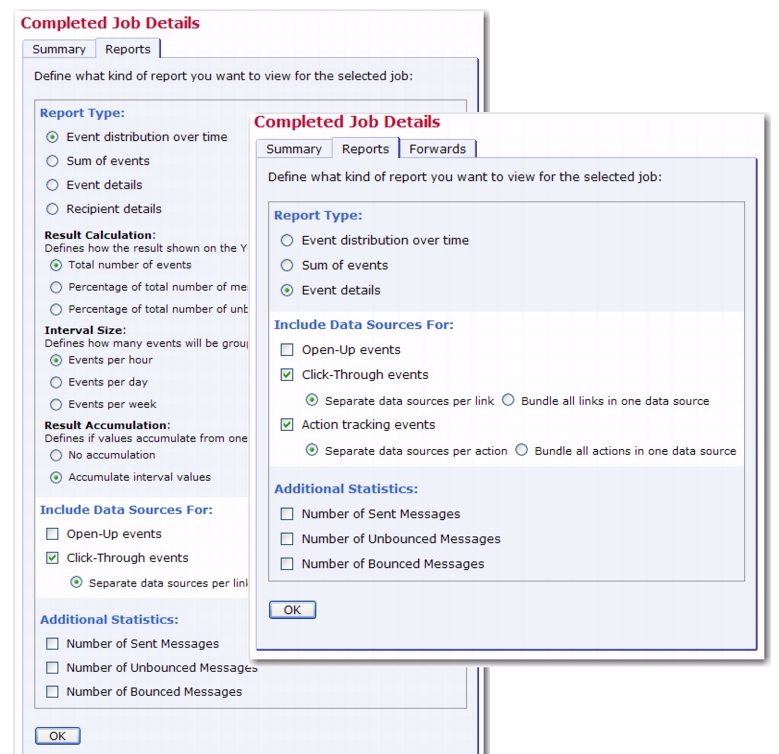
On the Completed Job Details screen, click the Reports tab to generate a quick report on the current job (as long as tracking has been switched on for the job in question). Quick reports are predefined report types that create a temporary report based on the selected report settings and the active email job.
In the Report Type sections, select one of the following:
|
•
|
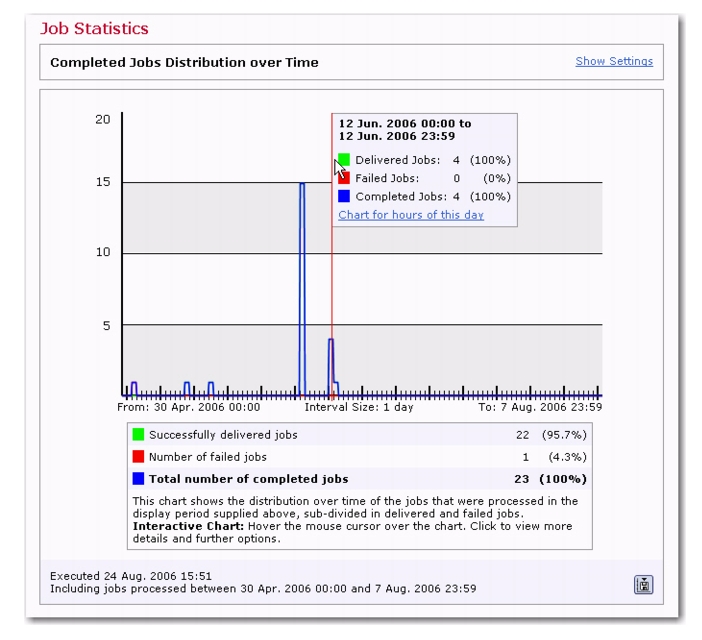
Event distribution over time – This report type produces a simple line graph showing the number of responses over time. Time is plotted on the x-axis of the chart and event statistics are charted on the y-axis. For more information on event distribution reports, see Section 13.7 Event Distribution Report.
|
|
•
|
Sum of events – This report type produces a bar graph that shows the number of recipients who clicked on each URL and/or opened up the email message. The length of each bar shows the number of events. For more information on sum of events reports, see Section 13.8 Sum of Events Report.
|
|
•
|
Recipient Details – The Recipient Details report is only available for personal or anonymously tracked jobs because this report type is linked to recipient profile data. For more information on Recipient Details reports, see Section 13.9 Recipients Details Reports.
|
|
•
|
Event Details – The Event Details report is available for personal, unique, anonymous, and blind tracking jobs. This report displays a table that lists the report type, lists the time period of the report, allows for the selection of encoding for downloading the data, and allows for the selection of the time zone to reference the downloaded data. For more information on event details reports, see Section 13.10 Event Details Report.
|
Note: The rest of the options available on this screen will vary depending on the report type you selected.
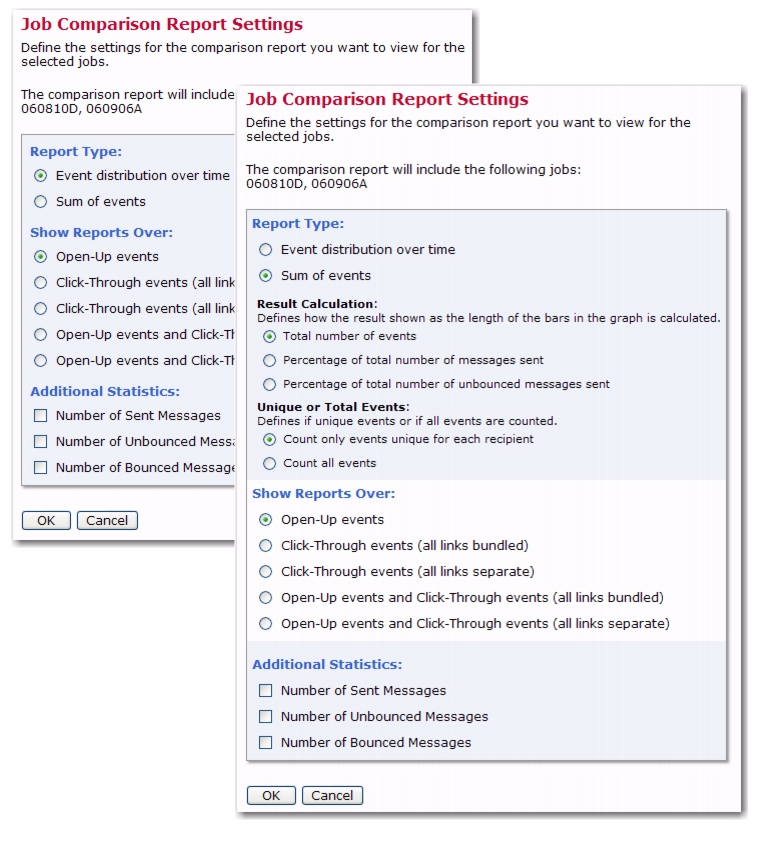
If the Result Calculation section is available, select one of these options to define how the result shown on the Y-/X-axis of the graph is calculated:
If the Unique or Total Events section is available, select one of these options to define if unique events or all events are counted:
|
•
|
Count all events – All events are counted, whether they are generated by the same recipient or by different recipients.
|
If the Interval Size section is available, select one of these options to define how many events will be grouped in each interval:
|
•
|
Events per hour – Each interval will count the events collected during a given hour.
|
|
•
|
Events per day – Each interval will count the events collected during a given day.
|
|
•
|
Events per week – Each interval will count the events collected during a given week.
|
Note: With small intervals, the curve will be smoother because there are more intervals to display. However, using more intervals will mean that the calculation of the report will take longer.
If the Result Accumulation section is available, select one of these options to define whether or not values should accumulate from one interval to the next:
|
•
|
No accumulation – Each interval will only show the events counted from the beginning of the interval to its end. This means that the curve will rise and fall, depending on the event occurrence during each interval.
|
|
•
|
Accumulate interval values – Each interval will show the accumulated number of events counted from the very beginning of the report period until the end of the interval. This means that the curve may only rise, but never fall. However, as events get more and more sparse with each proceeding report period, the curve will become less and less steep, until it tapers out into an (almost) horizontal line.
|
In the Include Data Sources For section, select the type and the bundling of events to appear in the report:
|
•
|
Open-Up Events – This option bundles all open-up events together into one variable charted on the report.
|
In the Additional Statistics section, check any of the following options to have additional statistics appear in the report:
|
•
|
Number of Sent Messages – This option adds the number of messages that were sent with the job as a constant reference value to the report.
|
|
•
|
Number of Bounced Messages – Another constant reference value is added to the report. This value shows the number of messages that were sent with the job but were detected as bounces. (See "About Bounces" below.)
|
|
•
|
Number of Unbounced Messages – This constant reference value shows the number of messages that were sent with the job and were not detected as bounces.
|
If the job is part of an auto-repeat sequence, and the report should total all of the data over all of the jobs run in the sequence so far, then check the
Include all auto-repeat instances of this job in the report option. Uncheck this option to generate a report for a single run.
Once you’ve selected a report type, a source data type, and any additional statistics using the option buttons. Click
[OK] to continue. A report will be generated based on your selections. For a more detailed report or to edit the report, click the
Go to the edit page of this report link.
Located at the bottom right side of the report are four icons. Each icon opens a screen with different functions and options. The currently selected icon will be highlighted with a blue border. Icons that are unavailable will appear grayed out. These icons appear on all test report, quick report, and regular report pages.
Tip: When you scroll over the data in the report, a small gray box will display the time period. To display even more information, click on this box. The information in the gray box is expanded and displays links for generating reports based on that particular time period.
To save a quick report as a regular report, click the Create Report icon. This opens the Define Report screen. Click the
[Save & Execute] button and the quick report will be saved as a regular report with the same name. Instructions for further editing and using reports are covered in Section 13
Tracking Reports.
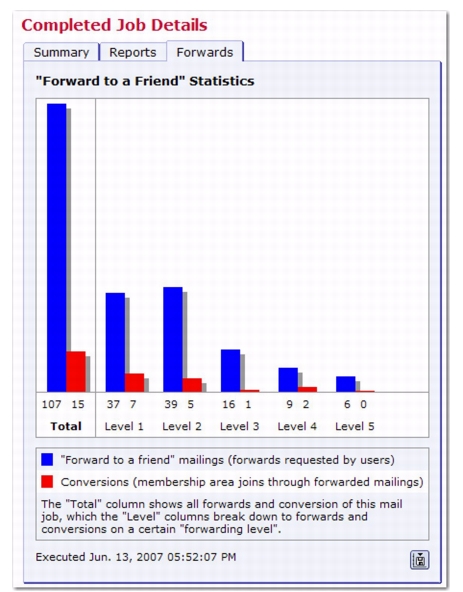
If the Forward-to-a-Friend feature and “Forward to a Friend” tracking was enabled for an email job, then the Forwards tab on the Complete Jobs Details screen is available. This tab displays a report that charts all forward requests and conversions. Forward requests are forwards requested by users, either by the original recipients or by friend-recipients. Conversion occur when someone joins the membership area using the special {{*SubscribeURL}} link in the forwarded message.
The Job Comparison report lets you dynamically compare the tracking events for two or more jobs (up to 12 jobs can be included). Job Comparison reports can be run to compare separate standard jobs or to compare the variants of an A/B-Split Job, which can help you figure out the best variant for the job.
To compare two or more standard jobs, go to the Completed Jobs screen, click on Mail Job, select
Multiple Job Action, and then select
Enable Multiple Job Actions. Select the jobs that you want to compare, and then select
Mail Job >
Multiple Job Action >
Job Comparison Report.
The Job Comparison Report Settings Screen opens.
To compare the variants of an A/B-Split Job, go to the Completed Jobs screen and select the A/B-split Job (not one of its variants) that you want to work with. The A/B-Split Job Details screen opens. From here, select
Mail Job >
Comparison Report for Completed Variant Jobs.
The Job Comparison Report Settings Screen opens.
Sum of events – A bar graph that summarizes the number of recipients that clicked on each URL or opened up the email (the number and size of displayed bars depends on how the statistics are bundled, see choices below).
Note: The rest of the options available on this screen will vary depending on the report type you selected.
Count all events – All events are counted, whether they are generated by the same recipient or by different recipients.
Events per hour – Each interval will count the events collected during a given hour.
Events per day – Each interval will count the events collected during a given day.
Events per week – Each interval will count the events collected during a given week.
Note: With small intervals, the curve will be smoother because there are more intervals to display. However, using more intervals will mean that the calculation of the report will take longer.
No accumulation – Each interval will only show the events counted from the beginning of the interval to its end. This means that the curve will rise and fall, depending on the event occurrence during each interval.
Accumulate interval values – Each interval will show the accumulated number of events counted from the very beginning of the report period until the end of the interval. This means that the curve may only rise, but never fall. However, as events get more and more sparse with each proceeding report period, the curve will become less and less steep, until it tapers out into an (almost) horizontal line.
Open-Up Events – This option bundles all open-up events together into one variable charted on the report.
Note: Action Events are part of the new Action Tracking feature. For details see Section 19
Action Tracking.
Number of Sent Messages – This option adds the number of messages that were sent with the job as a constant reference value to the report.
Number of Bounced Messages – Another constant reference value is added to the report. This value shows the number of messages that were sent with the job but were detected as bounces. (See "About Bounces" below.)
Number of Unbounced Messages – This constant reference value shows the number of messages that were sent with the job and were not detected as bounces.
The Job Reports Tab displays the individual reports of all included jobs in the comparison report. Only one individual report is displayed at a time. Select the job for which you want to display the individual report from the
Show report for job drop-down menu at the top of the tab. The displayed report is similar to the normal report that can be displayed for a completed job via the Reports tab on the job's Completed Job Details screen (see Section 12.5
Completed Job Reports for details on this tab. For details about how to interpret the report, see the online help.
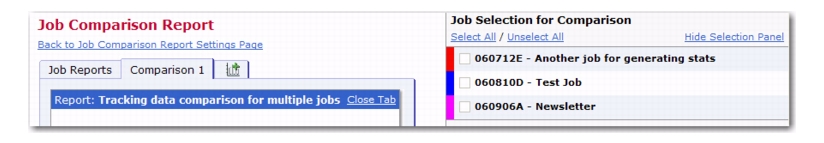
The comparison tabs are the heart of the job comparison report: There can be any number of these tabs and each tab can be used to create an individual comparison of the data sources from various of the included jobs in the report.
Additional comparison tabs can be added by clicking the Add New Comparison Tab icon that appears on a separate little tab at the top. When you click this icon, a new comparison tab will be created. This tab can be used for individually configured comparisons of the tracking events of several of the included jobs. There can be any number of such additional comparison tabs, for various comparisons (see below for details).
Click the Back to Job Comparison Report Settings Page link at the top of the page to go back to the settings screen, which is where you can change the general settings for the report (for example the report type and the type of the included data sources).
To close a certain comparison tab, click the Close Tab link at the top right of the tab.
Each freshly created comparison tab is initially empty and waits for you to select the jobs and report data sources to compare. For this selection, use the
Job Selection for Comparison panel that appears at the right side of the window whenever a comparison tab is the active tab.
On this panel, select the jobs that you want to compare by selecting their corresponding checkboxes. For each selected job, you may then also select one of its data sources to be included in the comparison chart. So for each selected job, there will always be exactly one data source that is included. Each job has an associated color which is displayed as a colored margin at the left on the selection panel. This color will be used to represent the selected data source of this job in the comparison chart. Depending on the type of the report, the data source will appear either as a colored line (in a "distribution over time" chart) or as a colored bar (in a "sum of events" chart).
Use the Select All and
Unselect All links at the top of the panel to quickly select or unselect all jobs in the list.
By choosing the right combination of selected jobs, and for each job the selected data source, you can build your own individual comparison chart, which allows you to directly compare the data that interests you. And, by adding more comparison tabs, you can create several of these comparison charts. You can then quickly switch between these different charts by switching between the different comparison tabs.
For example, on one comparison tab you could compare the open-up data sources of several jobs, while on another comparison tab you could compare the click events for a certain link that appears in several jobs, or any other useful combination.
If you find a certain comparison chart especially useful, then you can use the Create Report icon at the bottom right of the comparison tab to create and save a standard tracking report that contains the selected jobs and data sources. You can then execute and view this report via the normal Tracking Reports list at any time, without having to go through the job comparison report interface again. (This option is only available if you have the necessary user rights and if at least one job is currently selected.)
Note: If you are working with a small window size, then the job selection panel may overlap the actual reporting tab. In this case, to be able to view the full reporting tab without having to scroll horizontally, simply hide the job selection panel by clicking the
Hide Selection Panel link at the top right of the panel. Of course, while the panel is hidden you can no longer change the selection of jobs and data sources, so to show the panel again, click the
Show Selection Panel link that appears below the report on the reporting tab whenever the selection panel is hidden.
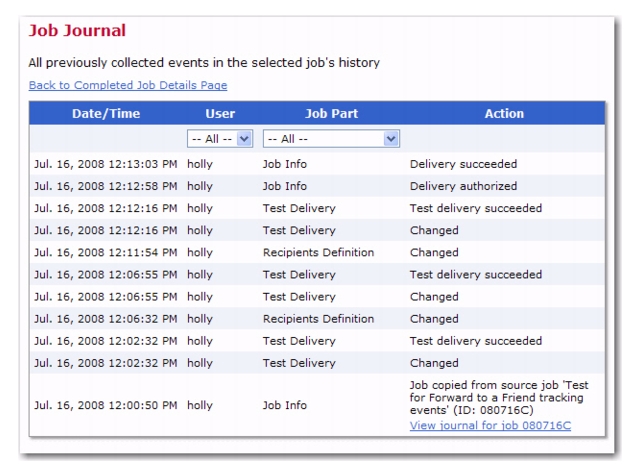
LISTSERV Maestro now provides you with a Job Journal that lists all previous events in the selected job's history, beginning with the job's creation in the system. All changes to the job are recorded together with information about the user who performed the change and what part of the job was changed. In addition, each record is reported with a timestamp, and the list shows the newest entries first.
If the job began its life as a copy from another job that still exists in the system, then the job creation history entry contains a shortcut link to this job. Click this
View journal for job [JOB_ID] link to open the journal of the source job.
To restrict the list to events triggered by a certain user and/or changes performed to a certain job part, simply choose the appropriate options from the
User and
Job Part drop-down menus at the top of the list.