Delivered Jobs contains a list of all the email jobs that have attempted delivery and the present state they are in - processed successfully or failed during delivery.
To view a list of delivered email jobs, click on the Delivered Jobs icon. The Delivered Jobs screen opens. Click on the ID of an individual job to open the Delivered Job Details screen. This screen is composed of two tabs, Summary and Reports. The Summary screen lists details for the selected job. The Reports screen contains options and links to generate a Quick Report on the selected job.
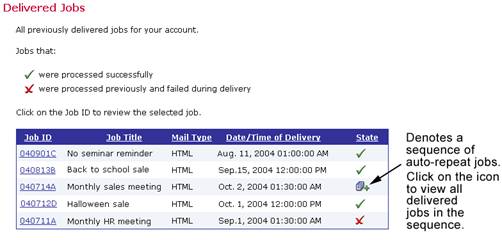
Only the first job of an auto-repeat sequence is normally shown in the list of delivered jobs. This is to avoid making the list overly long, filled with many jobs with the same job title, but with different Job IDs and delivery times. The first job of a sequence is marked by the Sequence icon shown next to the list entry.
By clicking on the Sequence icon, the sequence expands and displays all jobs in that sequence. From there, select any of these jobs by clicking on its ID. To hide the sequence jobs, simply click on the Sequence icon again or click on the icon of a different sequence, which will expand that other sequence and hide the sequence that was previously expanded. Only one sequence can be shown at a time.
Figure 74 Delivered Jobs
Note: A job might be processed successfully but still fail to be delivered. The processing state only describes the success or failure of the act of transferring the job to LISTSERV. If LISTSERV fails to deliver the job, no messages will be sent, but the job will still be in the “successful” state inside of LISTSERV Maestro. For example, if a job is sent to a LISTSERV list with the Standard list submit option, and using a sender address that is not authorized to post to the list, then the job will be successful, but LISTSERV sends an error message to the non-authorized email address, and no messages to recipients are actually delivered.
Tip: If a user suspects that a job that is shown as “successful” was actually never sent – for example, because recipients report that they never got the message – then the system administrator should check the LISTSERV logs to find out what happened to the job.
The Summary tab of the Delivered Jobs Details screen displays information about the delivered job. Click on the View link adjacent to a section to see more information on that particular section. Two additional links are available here – Update bounce count and View bounce details (See Section 9.2.1 View Bounce Details for more information). Click [Delete Job] to delete the job permanently. Click [Team Collaboration] to change the team collaboration settings for the job. Click on the Reports tab to generate a quick report.
Figure 75 Delivered Jobs Summary
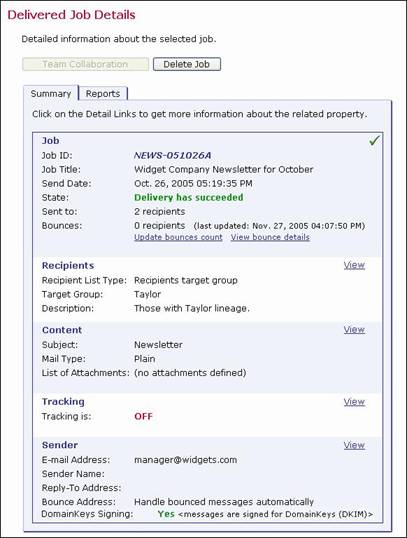
From the Summary tab of the Delivered Jobs Details screen, it is possible to update the bounce count and generate a graphical representation of the number and type of bounces for the job. Click on the View bounce details link to open the Bounce Details screen.
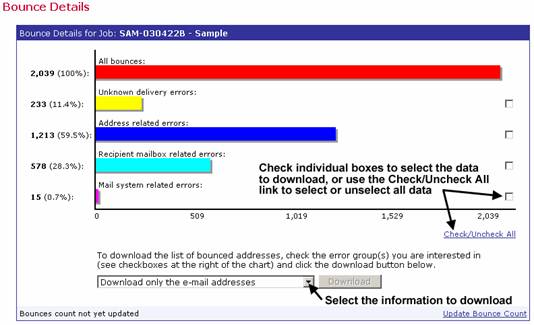
The Bounce Details report is comprised of color-coded bars that represent the number and type of bounces. The top bar displays the total number of al bounces. The bars below represent the total number of bounces divided into different bounce types. Bounce types are based on RFC error codes that define the characteristics of why the message bounced. The codes are documented in RFC 1893 "Enhanced Mail System Status Codes".
LISTSERV Maestro groups bounces into types based on the codes specified in this RFC. The group types LISTSERV Maestro uses are:
·
Unknown delivery errors
(RFC 1893 4.0.x and 5.0.x).
All otherwise unspecified errors.
·
Address related errors
(RFC 1893 4.1.x and 5.1.x).
Includes errors like "Unknown user at host" or "Unknown
host".
·
Recipient mailbox related
errors (RFC 1893 4.2.x and 5.2.x).
Includes errors like "Recipients mailbox full", "Mailbox
disabled" or "Mail too large".
·
Mail system related errors
(RFC 1893 4.3.x and 5.3.x).
Includes errors like "Mail system full" or "Message too
big for system".
·
Network related errors
(RFC 1893 4.4.x and 5.4.x).
Includes routing errors and errors like "No answer from host"
or "Bad connection".
·
Mail protocol related
errors (RFC 1893 4.5.x and 5.5.x).
Errors on the mail protocol level.
·
Message content related
errors (RFC 1893 4.6. x and 5.6.x).
Includes errors like "Conversion failed" or "Conversion
not supported".
·
Security or policy related
errors (RFC 1893 4.7.x and 5.7.x).
Errors for security or mail system policy reasons, like "Delivery
not authorized".
For more information on RFCs, see Appendix D: Email Related RFCs.
Use the check box adjacent to each bar to select it for download. Use the drop-down menu to download only those email addresses that bounced, or the email addresses with the delivery failure information included.
Figure 76 Bounce Details
Click on the Reports tab to generate a quick report on the current job (as long as tracking has been switched on for the job in question). Quick reports are predefined report types that create a temporary report based on the selected report settings and the active email job.
Figure 77 Delivered Jobs Quick Reports
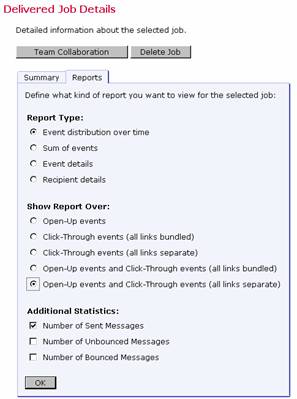
Creating a quick report is a multi-step process.
1. First, select the type of report to create. LISTSERV Maestro can produce four basic types of reports depending on the type of recipients and recipient data used in the job:
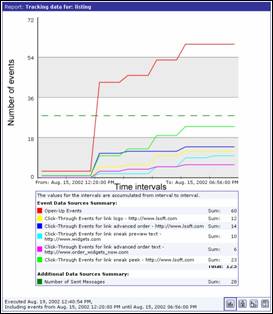
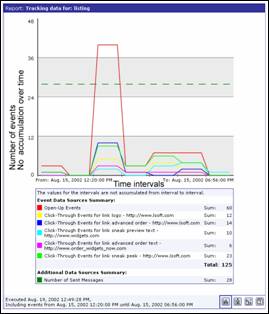
Event distribution over time – This report type produces a simple line graph showing the number of responses over time. Time is plotted on the x-axis of the chart and event statistics are charted on the y-axis. For more information on event distribution reports, see Section 10.3 Event Distribution Report
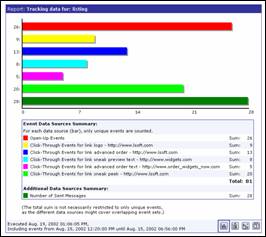
Sum of events – This report type produces a bar graph that shows the number of recipients who clicked on each URL and/or opened up the email message. The length of each bar shows the number of events.
Two types of sum can be chosen for the report – Sum of unique events or Sum of all events. Sum of unique events plots only a single event of each type for each recipient. This report will register “0” (zero) events if blind tracking has been selected for the tracking type during the tracking definition because blind tracking cannot count any event as unique. Sum of all events counts all events triggered for each recipient and is available for blind tracking. For more information on sum of events reports, see Section 10.4 Sum of Events Report.
Recipient Details – The Recipient Details report is only available for personal or anonymously tracked jobs because this report type is linked to recipient profile data. This report type displays a multi-frame table that lists each data source and the profile field columns from the recipients definition. Select the data from the top frame in the table by clicking the Select link. In the lower frame, click Select All to choose all the columns, or Edit to re-order and/or remove columns. Select the file encoding from the drop-down menu. The data will then be ready to download in the form of a ZIP archive file. Click the [Download] button to begin downloading the raw data to a local drive. Raw data can be used in Microsoft® Excel or other statistical software to create detailed reports. For more information on Recipient Details reports, see Section 10.5 Recipients Details Report.
Event Details – The Event Details report is available for personal, unique, anonymous, and blind tracking jobs. This report displays a table that lists the report type, lists the time period of the report, allows for the selection of encoding for downloading the data, and allows for the selection of the time zone to reference the downloaded data. Click the download link to download the raw data to a local drive. Raw data can be used in Microsoft Excel or third-party statistical analysis software to create detailed reports. For more information on event details reports, see Section 10.6 Event Details Report.
2. Next, select the source data for the report type. There are five choices depending on the type of message and the tracking selected for the job:
Open-Up events – This option charts all the open-up events for a job. It is only available for HTML messages.
Click-Through events (all links bundled) – This option bundles all click-through events together into one variable charted on the report.
Click-Through events (all links separate) – This option creates separate variables for each click-through event that is tracked.
Open-Up and Click-Through events (all links bundled) – This option bundles all the open-up events into one variable and all the click-through events into a second variable charted on the report. This only available for HTML messages.
Open-Up and Click-Through events (all links separate) – This option creates separate variables for each of the open-up and click-through events. This type of data source is only available for HTML messages.
3. Other data sources can be added to the chart by selecting any or all of the options in the Additional Statistics section. These additional data sources can provide comparison data in the chart so that it is possible to see the total number of messages sent in relation to the number of open-up events that occurred, for example. Three Additional Statistics options are available:
Number of Sent Messages – Adds the number of messages that were sent to LISTSERV as a constant reference value in the report.
Number of Unbounced Messages – Adds the number of unbounced messages as a constant reference in the report. This value shows the number of messages that were sent and not detected as bounces by LISTSERV. This value can go down over time as LISTSERV receives more bounces. This option is only available if LISTSERV handles bounces automatically (selected during the sender definition).
Number of Bounced Messages – Adds the number of bounced messages as a constant value in the report. This value shows the number of messages that were sent but were detected as bounces by LISTSERV. This value can go up over time as LISTSERV receives more bounces. Bounces usually stop coming in after about 5 days. This option is only available if LISTSERV handles bounces automatically (selected during the sender definition).
4. If the job is part of an auto-repeat sequence, and the report should total all of the data over all of the jobs run in the sequence so far, then check the Include all auto-repeat instances of this job in the report option. Uncheck this option to generate a report for a single run.
5. Once you’ve selected a report type, a source data type, and any additional statistics using the option buttons. Click [OK] to continue. A temporary report with the settings selected will be generated and displayed on the screen. This report will not be saved (it can always be run again from the Delivered Jobs screen), unless the Create Report icon, located at the bottom right of the screen, is clicked. This will open the Define Report screen where it is possible to save the quick report as a regular report, using the settings as a template.
Located at the bottom right side of the Delivered Jobs report are four icons. Each icon opens a screen with different functions and options. The currently selected icon will be highlighted with a blue border. Icons that are unavailable will appear grayed out. These icons appear on all test report, quick report, and regular report pages.
Table 5 Delivered Jobs Report Icons
|
|
View Report – Displays the currently selected report with the latest report options. |
|
|
Download Report – Opens the Download Report Result screen. From here, it is possible to download report data in a zipped text file. |
|
|
Change Results Settings – Opens the Change View Settings for Report screen. From here, it is possible to change how the results are displayed on the report. Extra reporting options are available here that are not available on the main quick report definition page. |
|
|
Create Report / Edit Report – This icon is called Create Report only if the report is a quick report. In that case, the Define Report screen opens with a new report that is pre-filled with the settings from the quick report. From here, it is possible to save the quick report as a normal report by clicking the [OK] button, or by clicking the [Save & Execute] button, which will display the report again as well as save it as a normal report. For delivery tests, it is not possible to save a quick report as a regular report, so this icon is disabled (grayed out). If an existing report from the reports list is executed by clicking its title or by clicking the [Save & Execute] button, this icon is called Edit Report. The Define Report screen opens, but a new report is not created. Instead, the existing report is opened the same way it is opened from the report list when the Edit link next to the report title is clicked. |
For more information on creating and editing reports, see Section 10 Tracking Statistics and Reports.
Figure 78 Line Chart Report of Events Distributed Over Time
|
|
|
The same data is shown below in a different report form.
|
Figure 79 Bar Chart Report of the Sum of Unique Events – Count
|
Figure 80 Bar Chart Report of the Sum of Unique Events – Percentage
|
To save a quick report as a regular report, click the Create Report icon. This opens the Define Report screen. Click the [Save & Execute] button and the quick report will be saved as a regular report with the same name. Instructions for further editing and using tracking reports are covered in Section 10 Tracking Statistics and Reports.